
You know what a carbon footprint is. You know emissions come in different scopes. But if someone asked you to picture an actual product carbon footprint example — for something you own, with real numbers — could you?
Most people can’t. That’s the problem — and that’s what this article fixes. Explanations usually stop at the concept. So let’s pick up something you probably own and take it apart.
A real product carbon footprint example: one pair of jeans
Levi’s actually measured everything — from the cotton field to the landfill — for a single pair of 501 jeans. The total carbon footprint: 33.4 kilograms of CO2. That’s roughly the same as driving a car 69 miles.
But the total isn’t the interesting part. Where those 33.4 kg come from is.
Where the emissions hide
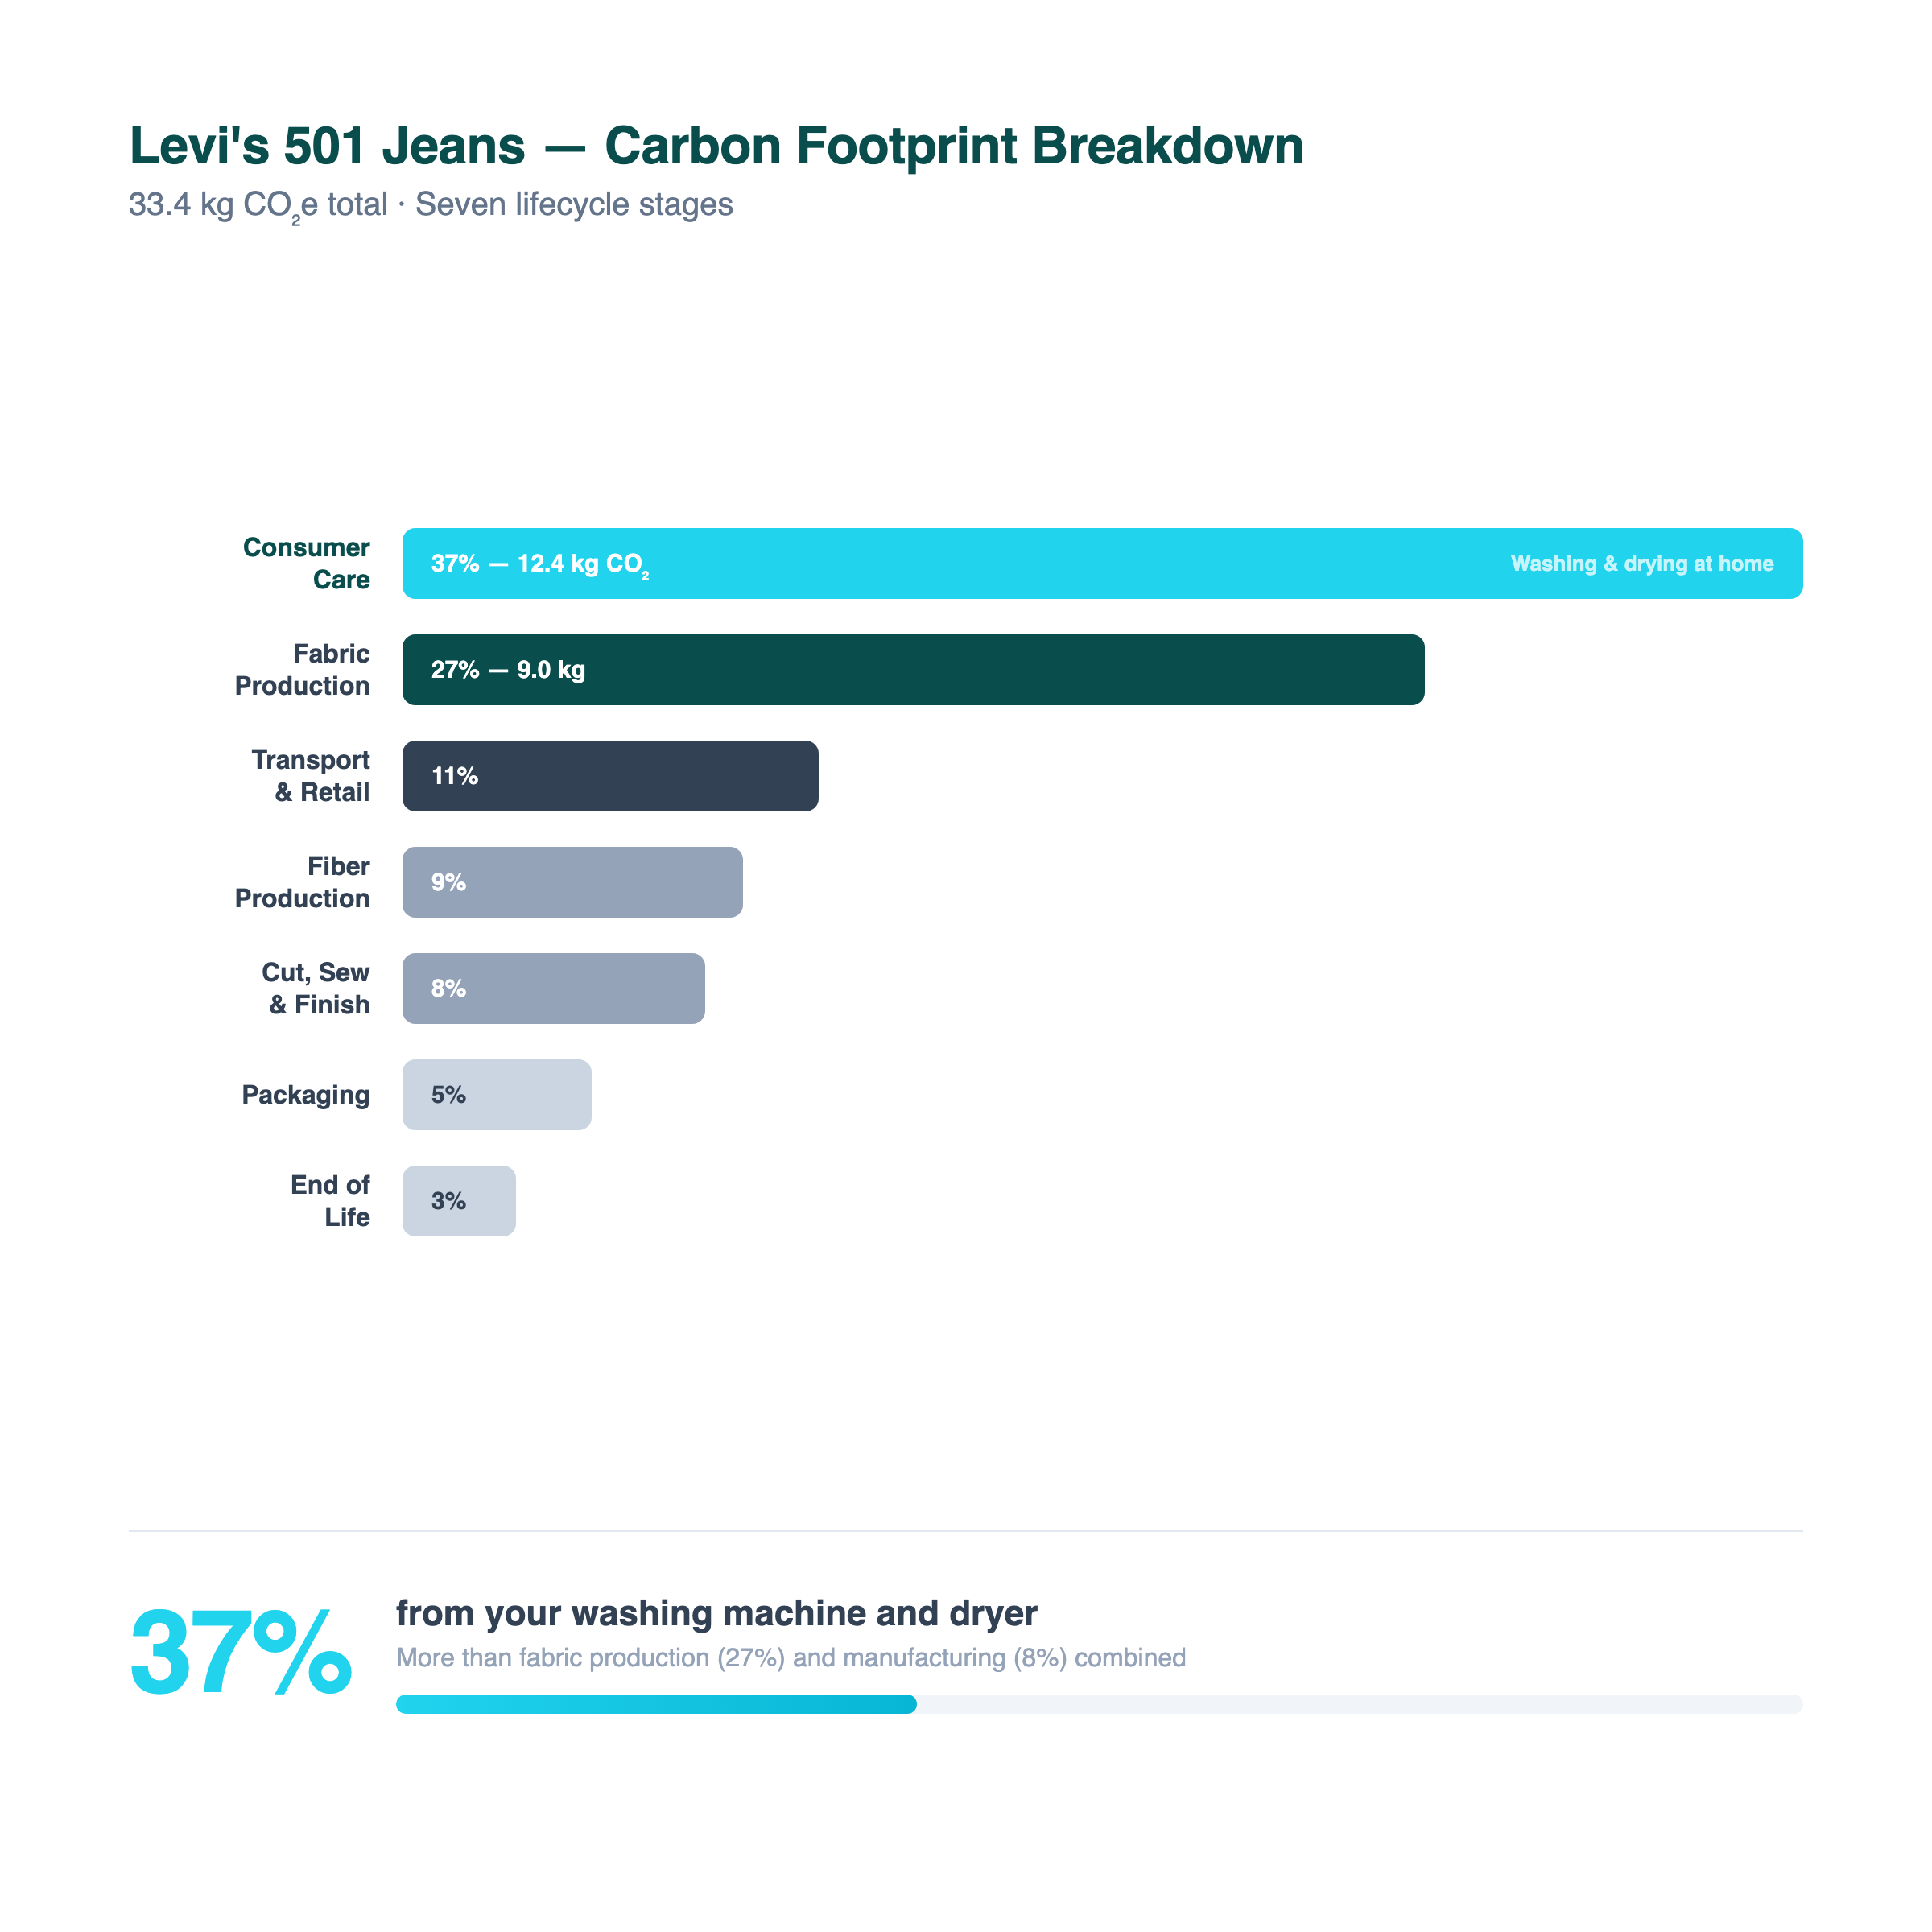
It starts with growing the cotton — about 9% of the total. Then comes fabric production — spinning, weaving, dyeing — which accounts for 27%. The factory floor where jeans are actually cut, sewn, and finished? Just 8%. Packaging and sundries add another 5%. Shipping the jeans to a store near you covers 11%.
Now here’s the part nobody expects.
Washing and drying your jeans at home — what Levi’s calls “consumer care” — accounts for 37% of the entire carbon footprint. That’s 12.5 kg of CO2. More than fabric production and manufacturing combined.
“Your washing machine and your dryer produce more emissions than the factory that made the jeans.”
Why this matters
Without a product carbon footprint breakdown like this, Levi’s would never have known that their biggest reduction opportunity wasn’t in the factory. It was in how customers use the product. (They now recommend washing jeans less often — a strategy that came directly from this data.)
Every product tells a different story
A loaf of bread has a completely different carbon footprint breakdown. Researchers at the University of Sheffield found that a standard 800g loaf produces about 1 kg of CO2. The surprise? Nearly half the emissions come from one input: the fertilizer used to grow the wheat. Not the baking. Not the delivery truck.
Different product, different hotspot. But the same method: break it down stage by stage, and the numbers tell you exactly where to look. Your product has a breakdown like this too. And your customer wants to see it.
So what does this mean for you?
When a customer sends you a sustainability questionnaire — the kind we talked about in Part 2 — this is what they’re building toward. Real numbers. Broken down by stage. Showing where the emissions actually are.
Carbon footprints aren’t abstract. They’re measurable. And once you’ve seen what one looks like, the next question is: who’s behind the rules that require this? Who sets the standards, keeps score, and decides whether your numbers are good enough?
That’s Part 4 — the regulators, the scoreboards, the buyers, and the investors who make carbon reporting mandatory.